 Image: Ralph Losey with AI.
[EDRM Editor’s Note: EDRM is proud to publish Ralph Losey’s advocacy and analysis. The opinions and positions are Ralph Losey’s copyrighted work. All images in the article are by Ralph Losey using AI. This article is published here with permission.]
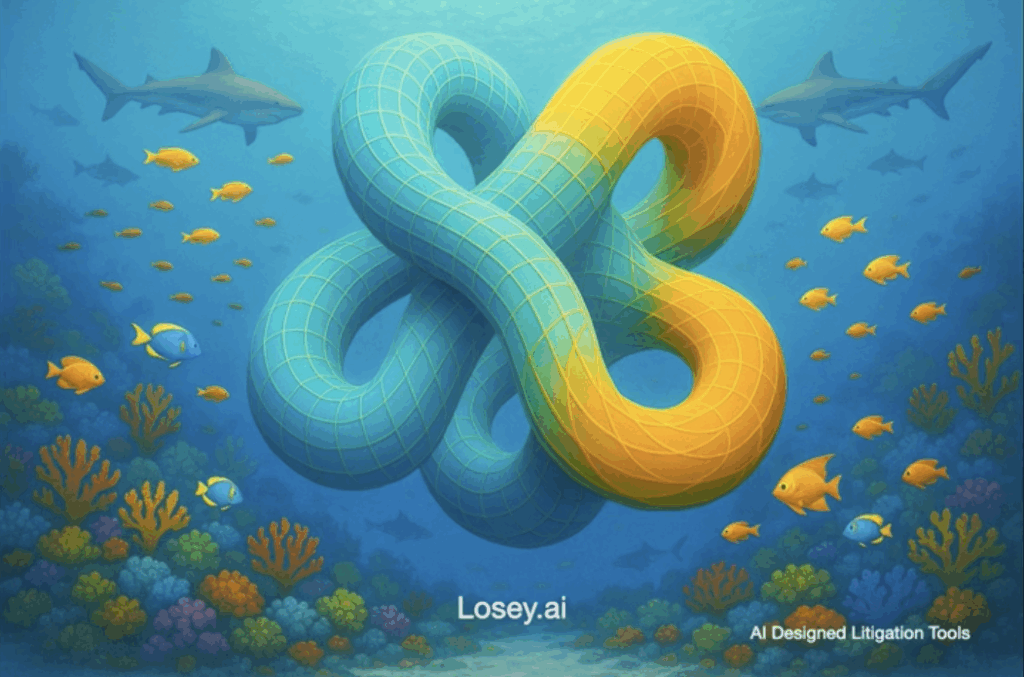
What if justice had a shape — not rigid scales or a blindfolded figure, but a living, dynamic map? Imagine causation as a multidimensional space, where influence, control, and responsibility could be mapped across a moving legal landscape, like tides over a reef. That is the vision behind Topological Jurisprudence, a framework first glimpsed through work with applied mathematics using advanced AI — now, for the first time, including ChatGPT-5.
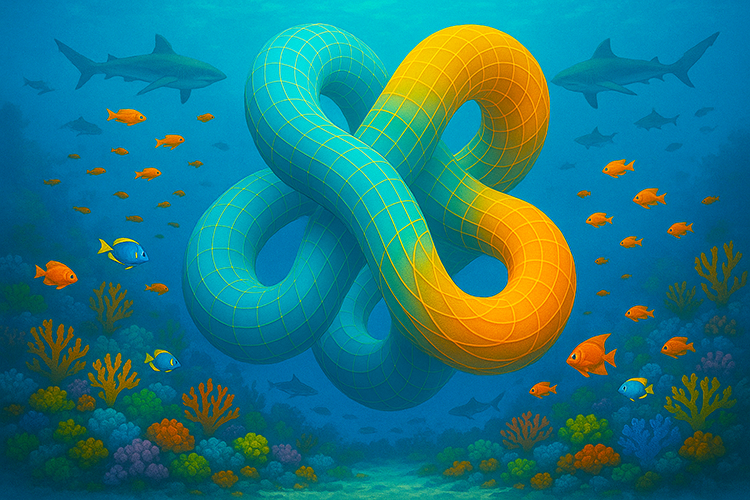 Underwater topological network — visualizing justice as tides over a reef. Created by Losey using multiple AI tools. Click for YouTube.
Using topological network mapping, we set out to see if this next-generation AI can turn an abstract mathematical concept into a practical tool for mapping fault in law’s most complex disputes.
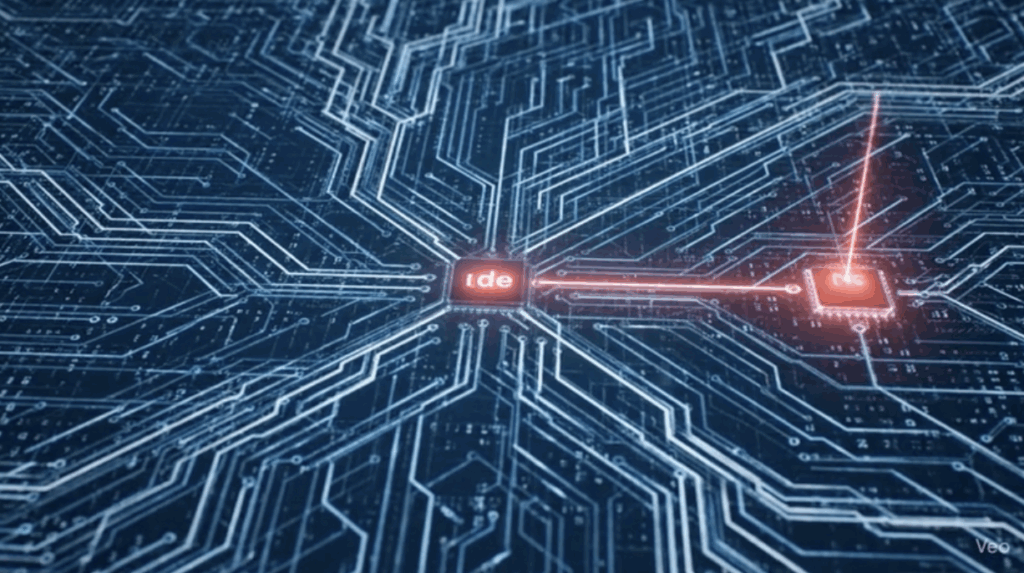
 Introducing Topological Jurisprudence — a near-future legal-tech vision where mathematics meets liability analysis. Image by Losey using multiple AI tools. Click for YouTube.
This idea may sound like science fiction, but it is grounded in topological data analysis (TDA, a branch of applied mathematics built to reveal patterns and relationships in complex, evolving systems. Here, the courtroom meets the mathematics of shape and flow. In the pages ahead, I move from visual allure to substantive potential: can AI-driven topology bring clarity to the most complex causation disputes of our digital age?
And this time, the question is tested with tools that didn’t exist when I began this journey. In Epiphanies or Illusions, Parts One and Two, I explored whether AI could find meaningful cross-domain patterns at all. Now, with GPT-5’s leap in cross-disciplinary synthesis, I can ask something new: not just “can it see the pattern?” — but “can it carry that insight into a framework lawyers can actually use in court?”
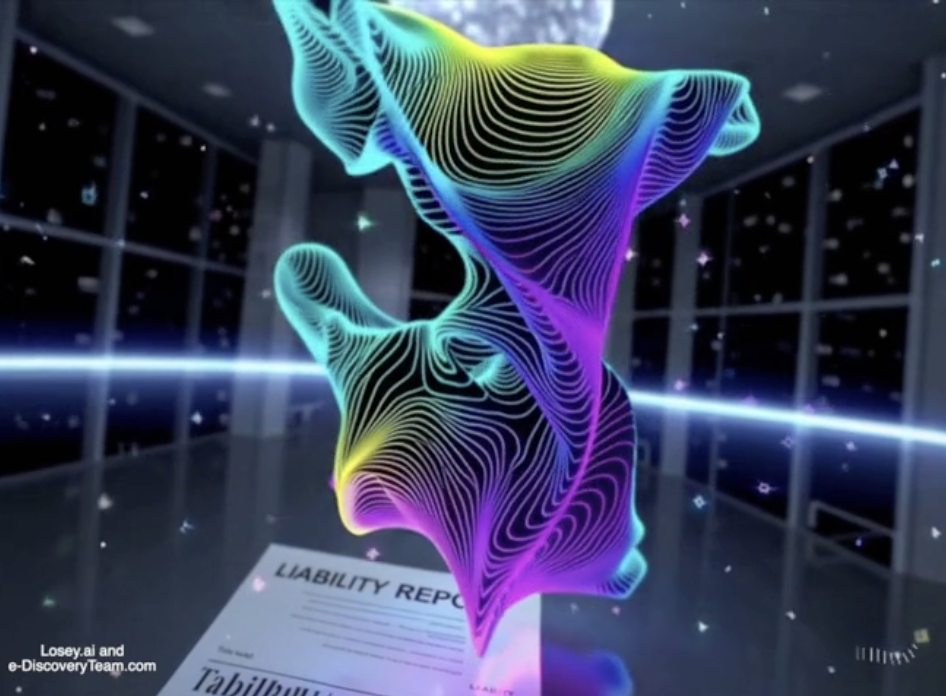
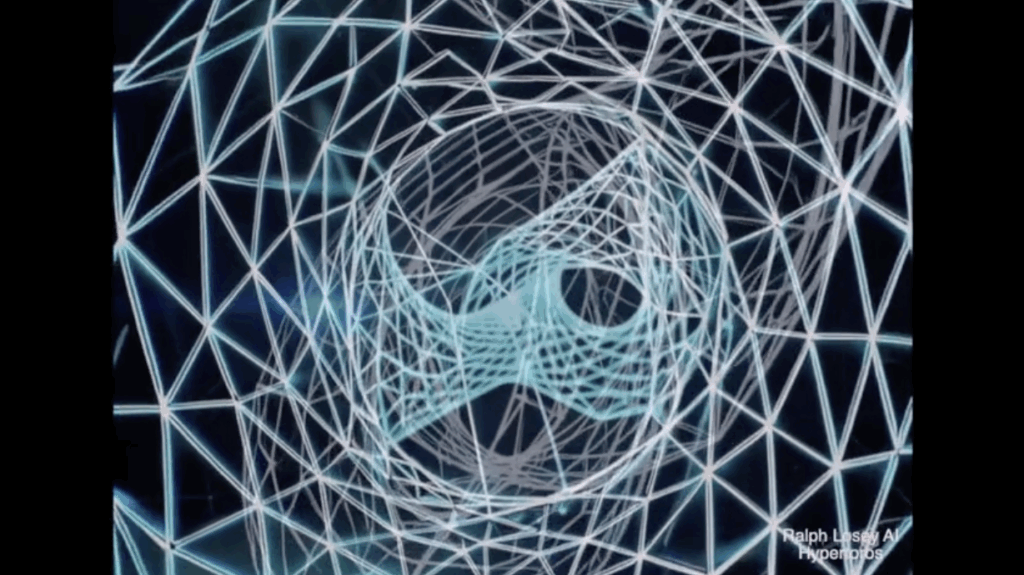 Visual composition set to original music to get a ‘left and right brain’ feel for this new approach. It shows the curvature and flowing connectivity at the heart of the topological perspective. Click for YouTube.
From Epiphany to Application
The Shape of Justice is my first major legal-technology project to apply GPT-5’s markedly improved abilities in cross-disciplinary pattern recognition and synthesis.
WHY GPT-5 MATTERS? GPT-5 can keep legal rules precise while integrating mathematics, simulations, and causation theory into a single, usable framework. Earlier models could suggest patterns; GPT-5 can carry them through to courtroom-ready analysis.
Where GPT-4o could propose intriguing links, GPT-5 can integrate them into a coherent, working framework without losing the rigor of either discipline. Here, that means fusing the mathematics of topology with the logic of proximate cause, comparative fault, and courtroom evidence.
The result is a practical tool — Topological Jurisprudence — that can map complex causation in a way static diagrams and bullet-point briefs cannot. It can show where fault originates, where it converges, and, as the case study ahead demonstrates, where it never touches a party at all.
 A judge contemplates the multidimensional shapes of causation — where legal reasoning meets mathematical mapping. Image by Losey using Visual Muse.
Why Traditional Tools Break Down
In simple negligence, causation is a straight line:
Defendant A acted → Plaintiff B was harmed → liability follows.
But complex, multi-actor disputes — especially in high-tech contexts — rarely follow neat chains.
Consider:
- Autonomous vehicle accidents with components and services from multiple companies.
- Blockchain collapses involving code, governance votes, and trading patterns.
- International supply chain contamination where the source could be anywhere in a dozen linked facilities.
Traditional “branch tree” diagrams are static. They struggle with systems where relationships change over time or where multiple causes converge unexpectedly.
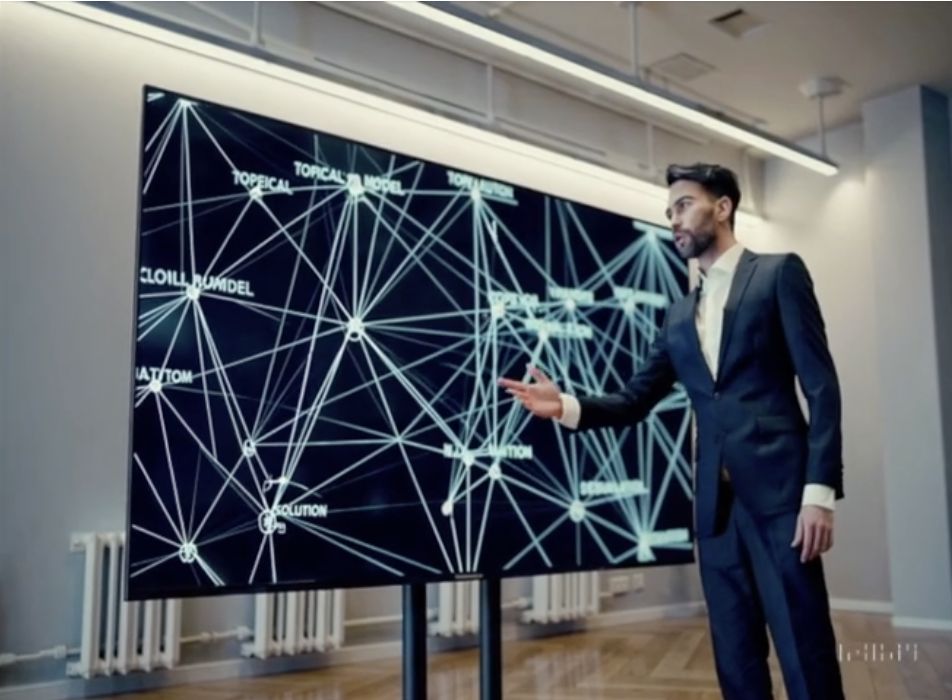
 Multidimensional accident causation map — showing how a topological model can reveal decisive interactions in complex systems. Even as the network evolves, stable patterns guide experts in assigning fault tied to legal duties and foreseeability. Video by Losey using AI. Click for YouTube.
What Topological Jurisprudence Brings
Topology is a branch of geometry that studies how points and connections form patterns that persist even as shapes stretch or shift.
Topological data analysis (TDA) applies this to complex datasets — finding relationships, clusters, and gaps that remain significant across different scales and conditions.
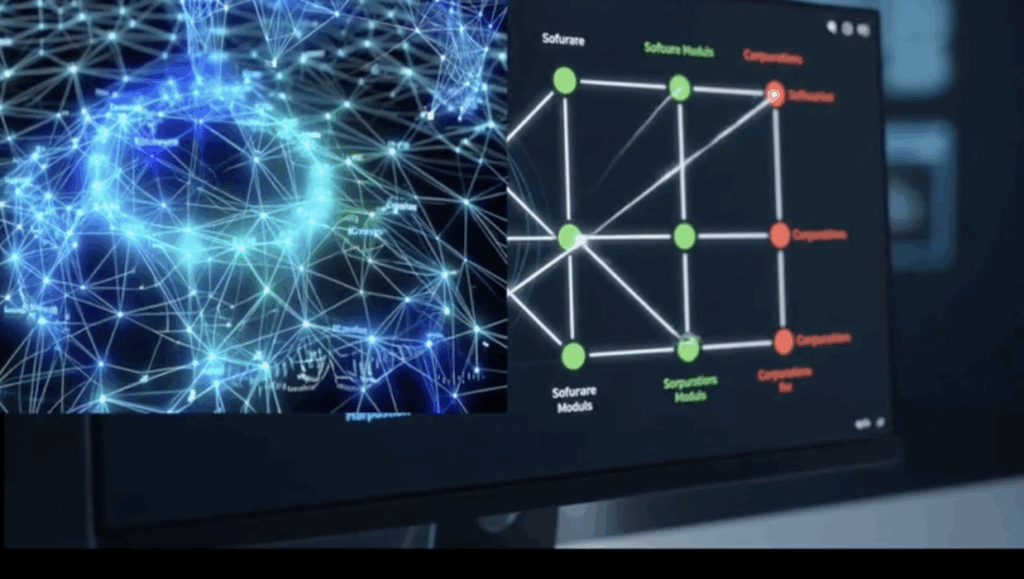
 Dynamic topological network visualization — illustrating how relationships between actors shift over time, while the underlying structure of causation remains clear. Such visual models can help experts explain liability allocation in complex, multi-party disputes. Video by Losey using AI. Click for YouTube.
For lawyers, think of it this way:
- Nodes = parties, devices, software modules.
- Edges = relationships between them — contracts, data flows, communications.
- Attributes = details on each connection — timestamps, amounts, governing law.
- Time layers = how nodes and edges change over time.
In litigation, this means you can see:
- Where fault starts.
- How multiple causes interact.
- Whether a party’s conduct ever intersected with the harm.
Case Study: The Autonomous Vehicle Pile-Up
Scenario:
A self-driving sedan manufactured by Alset Motors is involved in a multi-car collision. Eight claimants. Seven corporate defendants.
Jurisdiction: Florida, pure comparative negligence; no joint-and-several for ordinary negligence.
Actors
- Alset Motors – Vehicle manufacturer. All core systems and base software worked flawlessly.
- NaviAuto Corp. – Supplier of navigation and hazard-avoidance subsystem (Perception Stack v3.1.2).
- SensorCo – Supplier of LiDAR S-200 hardware used in NaviAuto’s subsystem.
- GeoMaps Inc. – Provider of real-time mapping and hazard alerts via API.
 Topological crash analysis in action — the model processes sensor data, system logs, and contractual links to produce a clear allocation of liability under Florida’s comparative fault rules. Video by Losey using AI Click for YouTube.
Topological Causation Pathway
- Impact (12:44:42 EDT): Alset’s braking system engages late but functions perfectly when commanded.
- Internal Failure (NaviAuto): Humidity causes LiDAR S-200 data to be misread by v3.1.2, creating a ~700 ms hazard-classification delay.
- External Failure (GeoMaps): API outage (HTTP 503) at 12:44:11 EDT prevents a hazard alert from reaching NaviAuto’s subsystem, removing a critical redundancy.
- Convergence: Two independent failures — one internal to NaviAuto, one external to GeoMaps — remove both the primary and backup hazard-mitigation layers.
Topological takeaway:
The causal lanes merge before the control signal reaches Alset’s braking system. Alset’s systems respond exactly as designed; no proximate cause is traceable to the OEM.
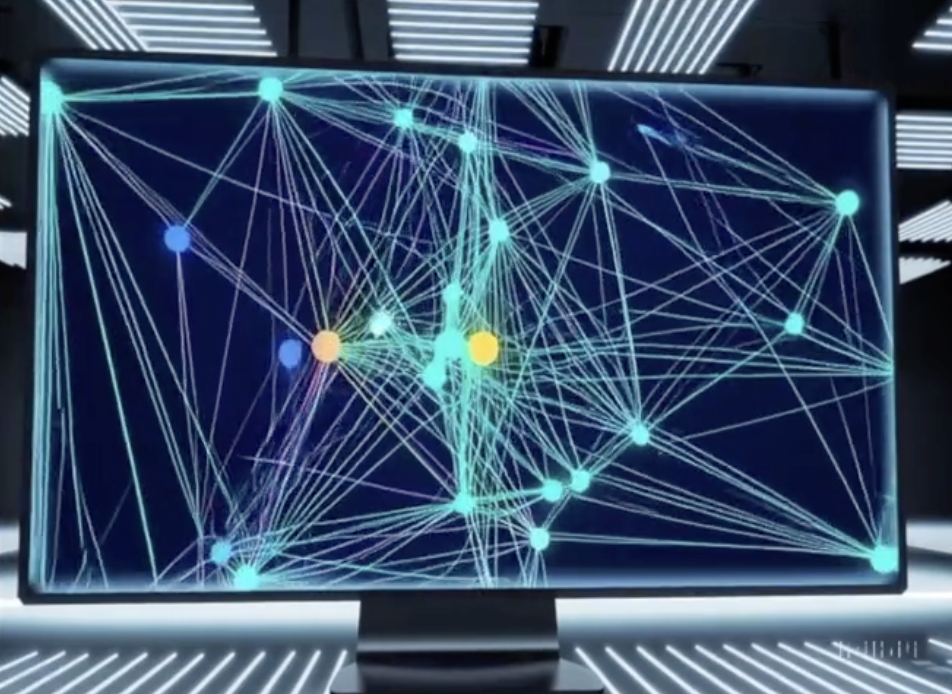 Dynamic Topological Liability Map — real-time visualization of actors, data flows, and causal links in a multi-party dispute. Is such a tool under construction? Video by Losey. Click for YouTube.
Counterfactual Stress Test
(Applying “but for” causation with measurable inputs)
- If GeoMaps’ warning had arrived within 2 seconds: The driver-assistance system would have reduced speed by ~8% within 1.5 seconds, avoiding impact in 94% of simulated runs.
- If NaviAuto’s delay were under 250 ms: The vehicle would have stopped short even without GeoMaps’ alert in 91% of runs.
Simulations were generated by adjusting one causal factor at a time within the topological model — like holding one defendant’s conduct constant while testing the others.
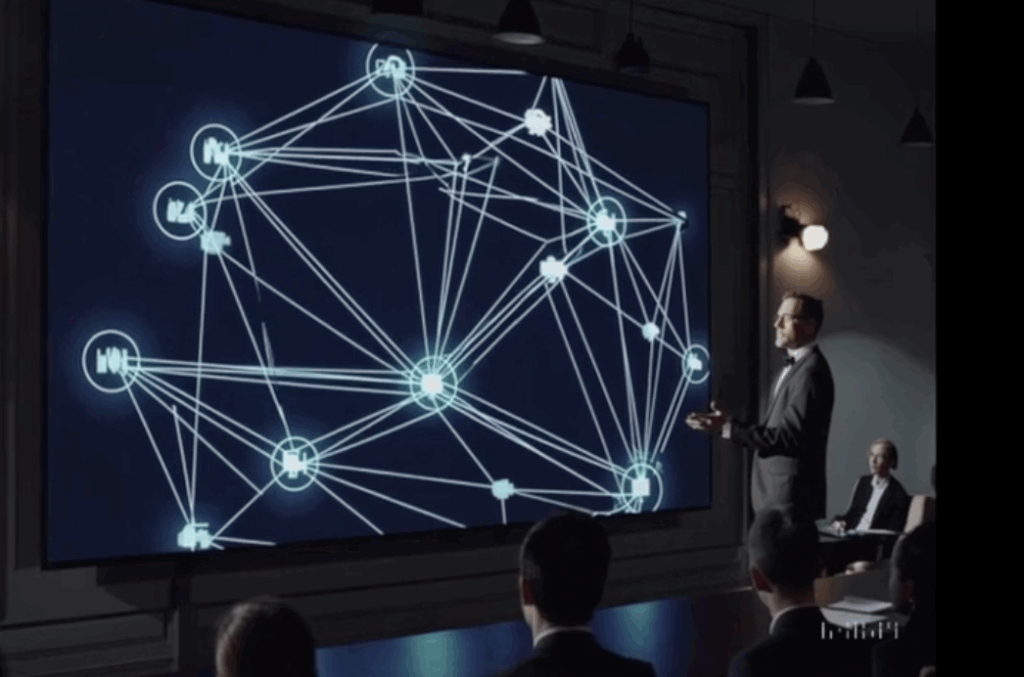
 Settlement negotiation using topological evidence — a lawyer presents the dynamic liability map to opposing parties, visually demonstrating fault distribution and strengthening the case for a favorable settlement. Video by Losey. Click for YouTube.
Conclusion for the Court
The collision was structurally inevitable due to:
- A software-hardware integration defect in NaviAuto’s perception system.
- A simultaneous outage of GeoMaps’ safety API.
Each failure removed a layer of hazard mitigation. Together they created a causal chain that no reasonable driver or automated system could have avoided.
Alset Motors is fully exonerated: no defect, no breach, no causation.
 Final courtroom presentation of topological evidence — after last-minute tech checks, counsel presents the TDA liability map to the judge The heartbeat underscores the stakes, and the post-verdict celebration shows the power of combining hybrid multimodal legal advocacy using advanced visualization tools. Video by Losey. Click for YouTube.
Analysis of Recommended Allocation
- NaviAuto Corp.: 65% — Defective subsystem integration; primary source of delay.
- GeoMaps Inc.: 30% — Outage removed redundancy, making delay outcome-determinative.
- SensorCo: 5% — Hardware performed to spec but catalyzed NaviAuto’s flawed integration.
- Alset Motors: 0% — No fault; systems worked as intended.
Rationale:
Allocation weights each party’s control over its failure point, proximity to harm, and foreseeability — the same factors Florida juries consider under comparative fault.
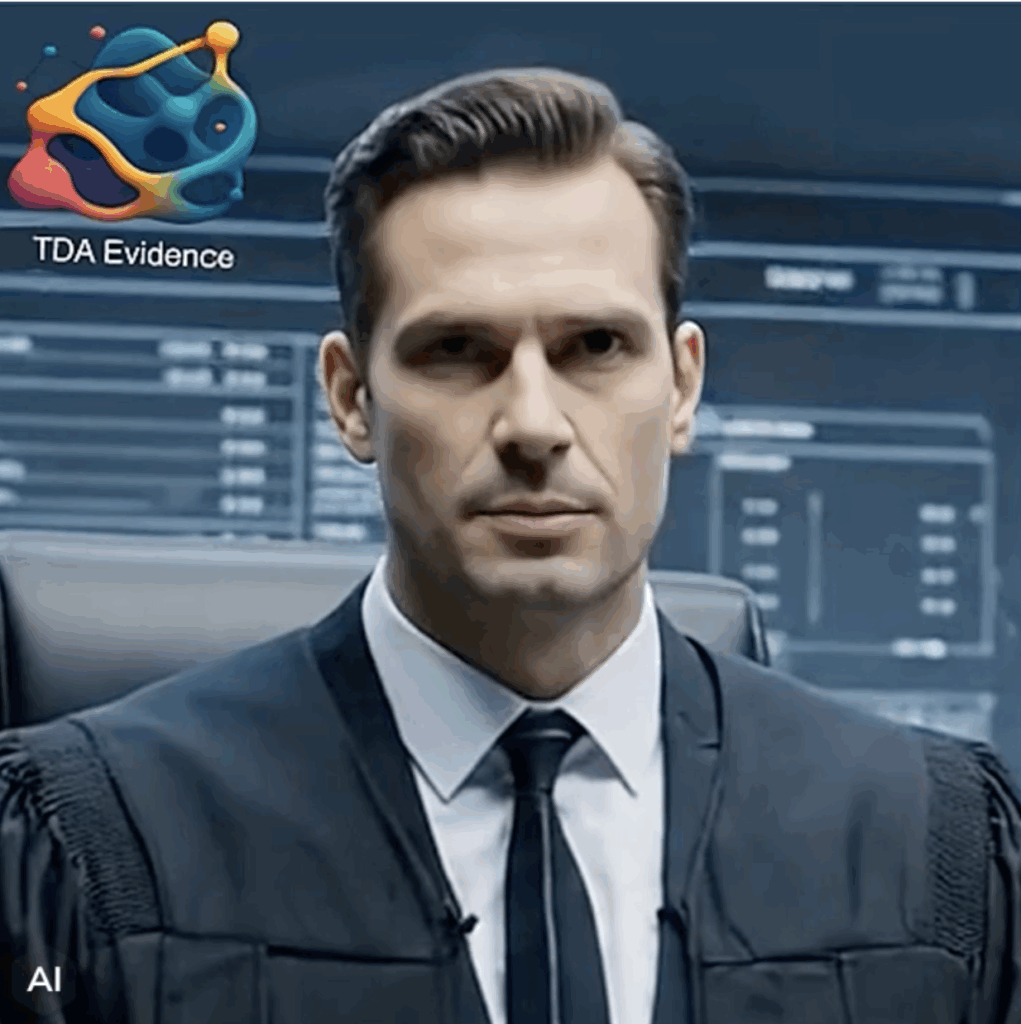 Judicial ruling following topological evidence presentation — the judge delivers a detailed decision affirming the admissibility and weight of the TDA-based causation map, and adopts its allocation of fault in the final award. Video and words by Losey. Click for YouTube.
Damages (Assume $10M Total)
- NaviAuto: $6,500,000
- GeoMaps: $3,000,000
- SensorCo: $500,000
- Alset Motors: $0
Topological network mapping can show where fault originates, where it converges, and where it never touches a party at all.
Important Legal Context (Florida Law)
Florida Statute 768.81 applies pure comparative negligence and eliminates joint-and-several liability for ordinary negligence.
Implications here:
- Each defendant is only responsible for its percentage of fault.
- Plaintiffs cannot shift uncollectible shares onto blameless defendants.
- In multi-defendant, high-tech litigation, precise apportionment supported by dynamic mapping can prevent an innocent party from being unfairly burdened.
 Topological network map illustrating liability allocation in the Autonomous Vehicle Pile-Up hypothetical. Alset (blue) is enmeshed in the system but not causally connected to the damages node (red). Created by Losey using Sora AI.
Conclusion: From Hypothesis to Legal Breakthrough
In Epiphanies or Illusions, Parts One and Two, the question was whether AI could uncover genuinely new patterns across fields — epiphanies that expand understanding rather than seductive illusions. Those articles were written before GPT-5 existed.
Now it does.
The Shape of Justice is the first application of my hybrid-multimodal method with GPT-5 in a legal context. The improvement is clear: GPT-5 doesn’t just suggest connections; it carries them into a coherent framework that respects the rigor of each domain. Here, it fused the geometry of topology with the doctrines of causation and comparative fault to produce a dynamic liability map that stands up to both mathematical and legal scrutiny.
As the closing scene suggests, it points to a future where human advocates and AI work side-by-side — reading the same evidence, interpreting the same patterns, and building cases together.
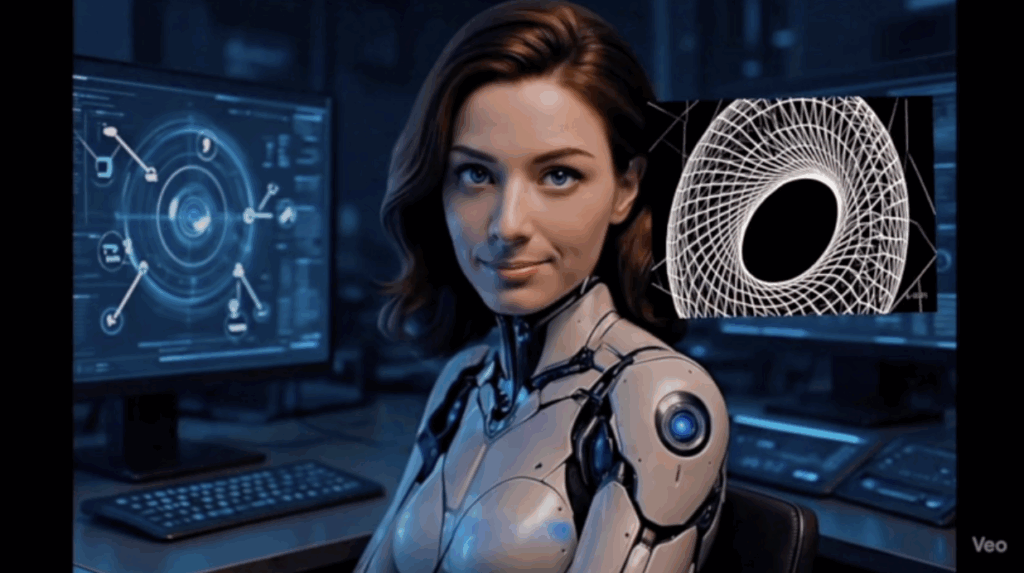
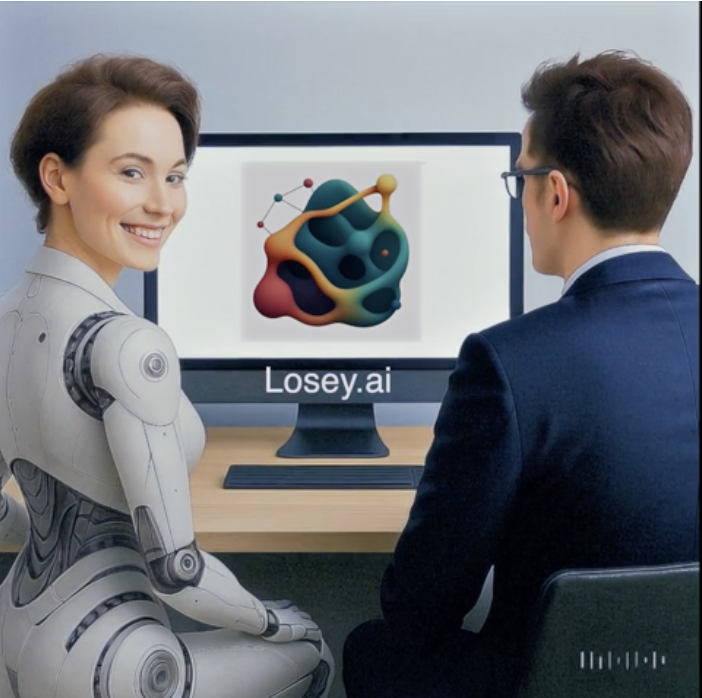 Human–AI collaboration in legal analysis — a lawyer and AI assistant study a live topological map, reflecting the potential for joint problem-solving in complex cases. Video by Losey and AI. Click for YouTube.
Using text prompting, structural mapping, simulation modeling, and seasoned legal analysis, GPT-5 and Losey are now building tools together that can:
- Precisely locate the origin of each causal lane.
- Map where those lanes converge in time and effect.
- Quantify “what if” outcomes.
- Support evidence-based liability allocation.
- Fully exonerate a blameless defendant.
The Autonomous Vehicle Pile-Up example is synthetic, but the principle is not. With real discovery data, the same method could be applied to actual cases, giving lawyers, judges, and mediators a clearer, more persuasive picture of complex causation.
 What examining causality and negotiating resolution may look like in the future — the Shape of Justice will differ in every case, but topological tools could become a standard part of how lawyers assess evidence and reach outcomes. Video by Losey using multiple AIs. Click for YouTube.
The question I asked in Parts One and Two was whether AI could help us tell the difference between genuine insight and comfortable illusion. With GPT-5, at least in this domain, I think we have our answer.
The shape of justice is not a scale. It’s a flowing, multidimensional space — a living structure where facts, causes, and consequences map across the legal landscape like tides over a reef.
 Beneath the surface, patterns ripple through law and technology—some true, some imagined. The quest is knowing which is which. Video by Losey using AI, Click for YouTube.
PODCAST
As usual, we give the last words to the Gemini AI podcasters who chat between themselves about the article. It is part of our hybrid multimodal approach. They can be pretty funny at times and provide some good insights. This episode is called Echoes of AI: The Shape of Justice: How Topographic Network Mapping Could Transform Legal Practice. Hear the young AIs talk about this article for 20 minutes. They wrote the podcast, not me.
 Image: Holley Robinson, EDRM with AI.
From Hypothetical to Real-World
With discovery data, topological network mapping clarifies causation for courts and neutrals and helps prevent liability from attaching to innocent parties. Losey.ai is building GPT‑5 tools now and welcomes TDA mathematicians to collaborate.
